Optibot + More
OptiBot
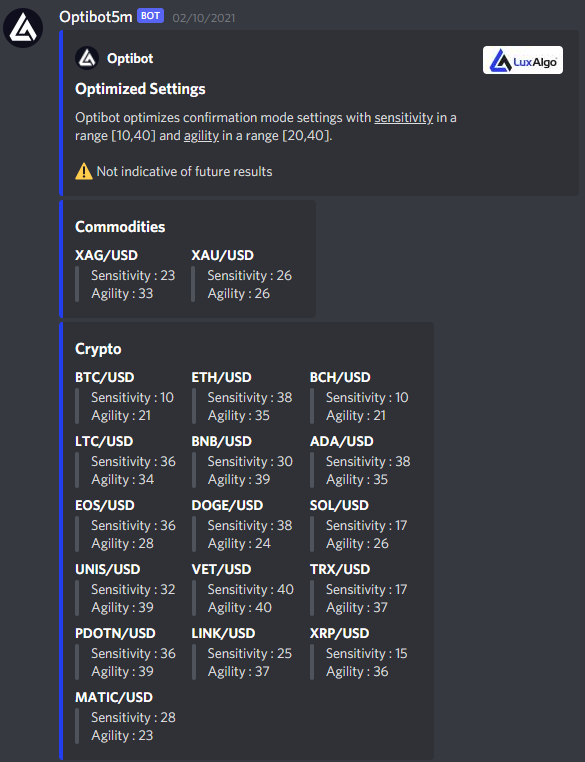
Optibot optimizes the sensitivity setting in a range from 10 to 40 and the agility setting in a range from 20 to 40 for confirmation signals across a variety of assets, optimized settings are the ones that yield higher returns (slippage and frictional costs are not taken into account).

Optimization is performed on the 5m, 15m, 30m, 1h, and 4h timeframes using the most recent 1000 bars of the following assets:
- Commodities
- Crypto
- Forex
- Stocks
- Indices
- Silver (XAGUSD)
- Gold (XAUUSD)
- Bitcoin (BTCUSD)
- Ethereum (ETHUSD)
- Ripple (XRPUSD)
- Bitcoin Cash (BCHUSD)
- Litecoin (LCTUSD)
- Binance Coin (BNBUSD)
- Doge (DOGEUSD)
- Solana (SOLUSD)
- Uniswap (UNISUSD)
- VeChain (VETUSD)
- Tron (TRXUSD)
- Polkadot (PDOTNUSD)
- Chainlink (LINKUSD)
- Theta (THETAUSD)
- Matic (MATICUSD)
- EURUSD
- GBPUSD
- USDJPY
- USDCHF
- AUDUSD
- USDCAD
- NZDUSD
- GBPCAD
- GBPJPY
- GBPCHF
- Facebook (FB)
- Amazon (AMZN)
- Apple (AAPL)
- Netflix (NFLX)
- Alphabet (GOOG)
- Tesla (TSLA)
- Boing (BA)
- Microsoft (MSFT)
- American Airlines Group (AAL)
- Southwest Airlines (LUV)
- United Airlines Holdings (UAL)
- Roku (ROKU)
- Advanced Micro Devices (AMD)
- Nvidia (NVDA)
- Robinhood (HOOD)
- Visa (V)
- Royal Caribbean Cruises (RCL)
- Carnival (CCL)
- Norwegian Cruise Line (NCLH)
- Square Inc (SQ)
- Zoom Video Communications (ZM)
- SP500
- DOW30
- NAS100
- DAX
- NIFTY50
Each optimizer is divided into four channels, one for each timeframe.
caution
OptiBot is not necessarily indicative of future results, optimized settings might change over time.
Pattern Detection Channel

The pattern detection channel posts the major chart patterns of various stocks occurring on the daily timeframe. These patterns may be newly formed or near completion and are posted every day at 2:00 pm UTC.
Satellites

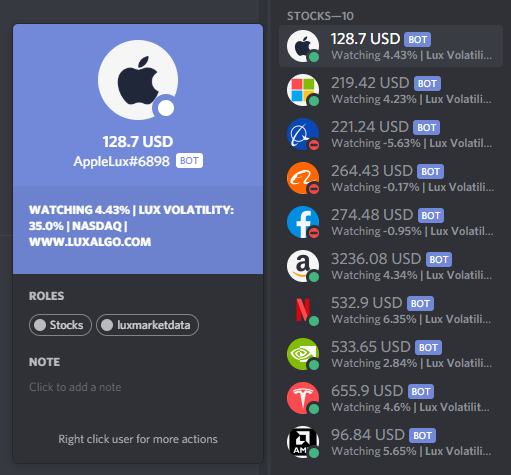
Satellites allow users to see various information regarding certain assets directly from the discord server and cover 10 stocks, 10 forex pairs, 5 cryptocurrencies, and 5 indices. The satellites can be found at the top of the member list section.
The price of the asset is displayed at the top right of the logo, when the price is rising a green circle will be displayed at the bottom right of the logo, when the price is decreasing a red circle will be displayed instead.
The number at the side of watching represents the percent changes while the value at the side of lux volatility represents the value of the lux volatility indicator as a percentage (default settings are used).